graphviz
Graphviz - Graph Visualization Software, documentation
canviz: graphviz on a canvas
Graphviz FAQ
http://graphviz.org/Documentation/dotguide.pdf
dot draws a graph in four main phases. The layout procedure used by dot relies on the graph being acyclic.
(1) Thus, the first step is to break any cycles which occur in the input graph by reversing the internal direction of certain cyclic edges.
(2) The next step assigns nodes to discrete ranks or levels. In a top-to-bottom drawing, ranks determine Y coordinates. Edges that span more than one rank are broken into chains of “virtual” nodes and unit-length edges.
(3) The third step orders nodes within ranks to avoid crossings.
(4) The fourth step sets X coordinates of nodes to keep edges short, and the final step routes edge splines.
* The dot language descries three kinds of objects: graphs, nodes, and edges. With in a main graph, asubgraphdefines a subset of nodes and edges.
* It is often useful to adjust the representation or placement of nodes and edges in the layout. This is done by setting attributes of nodes, edgets or subgraphs in the input file. Attributes are name-value pairs of character strings.
2. Drawing Attributes
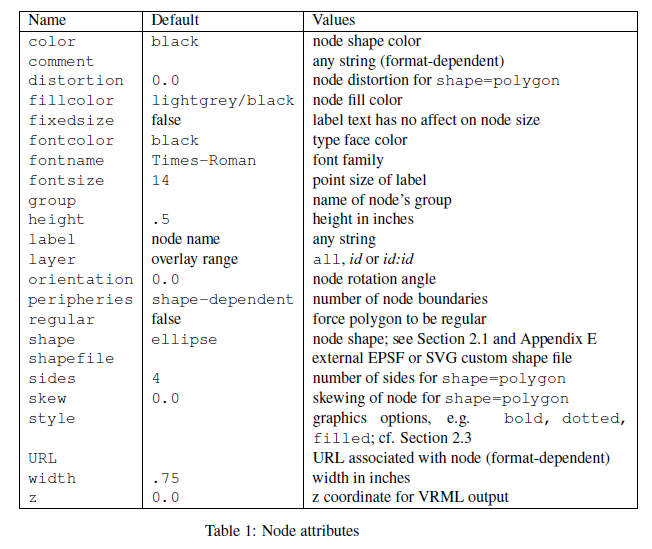
* Nodes are drawn, by default, widthshape=ellipse, width=.75, height=.5and labeled by the node name. Other common shapes includebox,circle,recodeandplaintext.
* The node shapeplaintextdraws a node without any outline, an important convention in some kinds of diagrams.
* In case where the graph structure is of main concern, and especially when the graph is moderately large, thepointshape reduces nodes to display minimal content. When drawn, a node's actual size is the greater of the requested size and the area needed for its text label, unlessfixedsize=true, in which case thewidthandheightvalues are enforced.
* The shapepolygonexposes all the polygonal parameters, and is useful for creating many shapes that are not predefined. In addition to the parametersregular,peripheriesandorientation, polygons are parameterized by number of sidessides,skewanddistortioin.
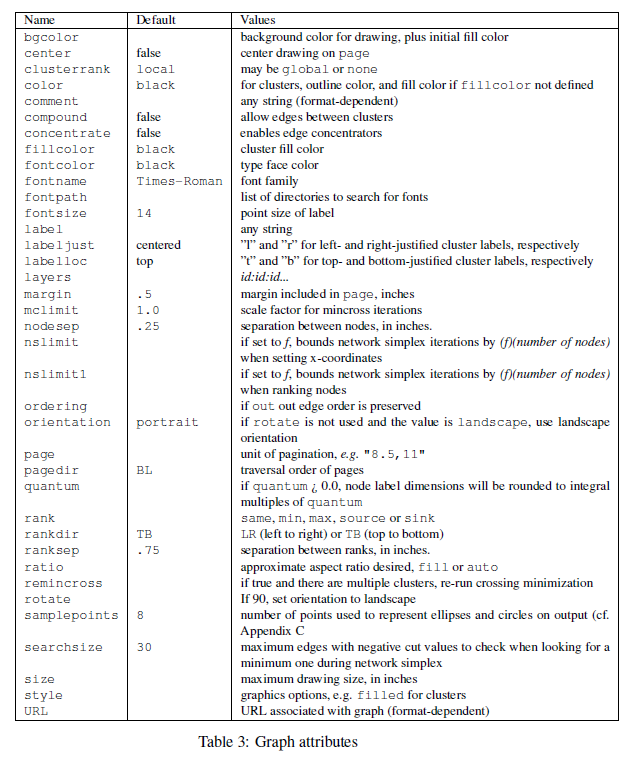
* Graphs and cluster subgraphs may also have labels. graph labels appear, by default, centered below the graph. Settinglabelloc=tcenters the label above the graph. Cluster labels appear within the enclosing rectangle, in the upper left corner. The valuelabelloc=bmoves the label to the bottom of the rectangle. The settinglabeljust=rmoves the label to the right.
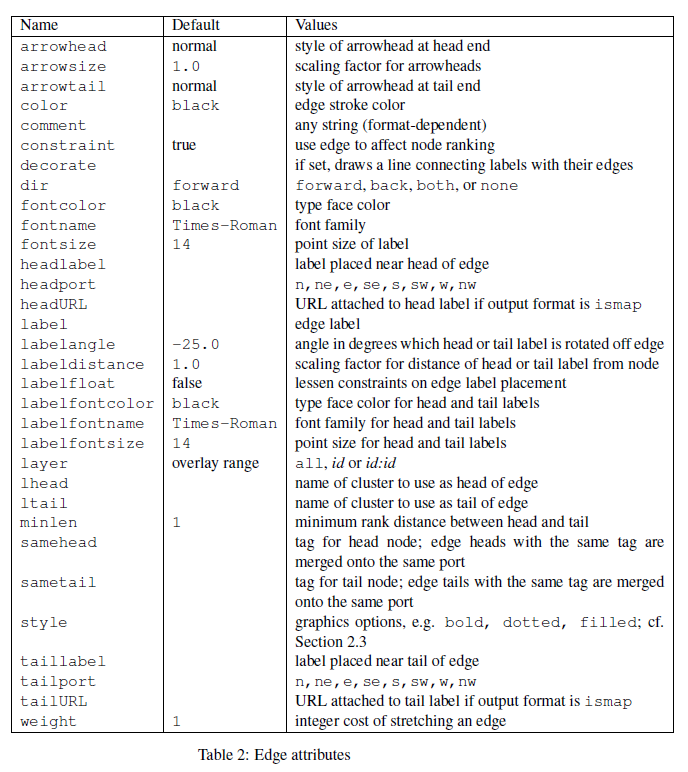
* Sometimes avoiding collisions among edge labels and edges forces the drawing to be bigger than desired. Iflabelfloat=true, dot does not try to prevent such overlaps, allowing a more compact drawing.
* An edge can also specify additional labels, usingheadlabelandtaillabel, which are be placed near the ends of the edge. The characteristic of these labels are specified using the attributeslabelfontname,labelfontsizeandlabelfontcolor.
2.5 Node and Edge Placement
* Therankof a subgraph may be set tosame,min,source,maxorsink.
* A valuesamecauses all the nodes in the subgraph to occur on teh same rank. If set tomin, all the nodes in the subgraph are guaranteed to be on a rank at least as small as any other node in the layout.
* This can be made strict by settingrank=source, which forces the nodes in the subgraph to be on some rank strctly smaller than the rank of any other nodes (except those also specified byminorsourcesubgraphs).
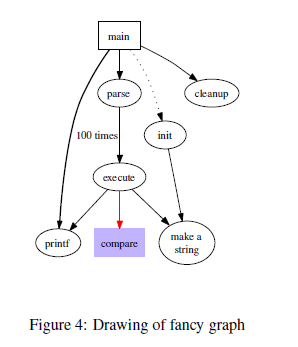
diagraph G {
  size = "4, 4";
  main [shape=box]; /* This is a comment*/
  main -> parse [weight=8]
  parse -> execute;
  main -> init [style=dotted];
  main -> clean up;
  execute -> {make_string; printf} /* makes edges from execute to make_string and printf*/
  init -> make_string;
  edge [color=red];
  main -> printf [style="bod, label="100 times"]
  make_string [label="make a\nstring"];
  node [shape=box, style=filed, color=".7 .3 1.0"];
  execute -> compare;
}
3.2 Clusters
* A cluster is a subgraph placed in its own distinct rectangle of the layout. A subgraph is recognized as a cluseter when its name has the prefixcluster.
* Labels, font characteristics and thelabellocattribute can be set as they would be for the top-level graph, though cluster labels appear above the graph by defaut.
* Clusters are drawn by a recursive technique that computes a rank assignment and internal ordering of nodes within clusters.
* If the top-level graph has thecompoundattribute set to true, dot will allow edges connecting nodes and clusters. This is accomplished by an edge defining anlheadorltailattribute. The value of these attributes must be the name of a cluster containing the head or tail node, respectively.
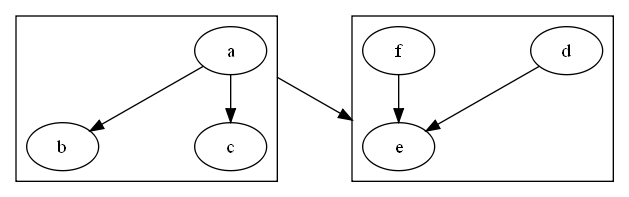
How can I create edges between cluster boxes?
This only works in Graphviz version 1.7 and higher. To make edges between clusters, first set the graph attribute compound=true. Then, you can specify a cluster by name as a logical head or tail to an edge. This will cause the edge joining the two nodes to be clipped to the exterior of the box around the given cluster.digraph G {
compound=true;
nodesep=1.0;
subgraph cluster_A {
a -> b;
a -> c;
}
subgraph cluster_B {
d -> e;
f -> e;
}
a -> e [ ltail=cluster_A,
lhead=cluster_B ];
}
ref:
lf387, Graphics: Automate the creation of graphs with Graphviz
![]()

沒有留言:
張貼留言